(Guide) Page Speed SEO: How To Make Your Website Faster
Ever feel like your website is quietly practicing social distancing from your customers? Orders dribble in slower than dial-up, ad budgets evaporate into bounce rates, and competitors leapfrog you on Google faster than a caffeinated kangaroo. It’s probably not your product—it’s your page speed SEO. Stick around and this article will walk you through the why and the how of making your site lightning-fast so Google smiles, users stay, and that lonely “Add to Cart” button starts singing the cha-ching chorus.
TL;DR
- Speed is a ranking factor. Google’s Core Web Vitals became part of the search algorithm in March 2024.
- Users are impatient. Google found that the probability of bounce soars 32 % when load time stretches from 1 s to 3 s.
- Milliseconds earn millions. Deloitte saw up to a 10 % jump in conversions after just a 0.1‑second mobile speed gain.
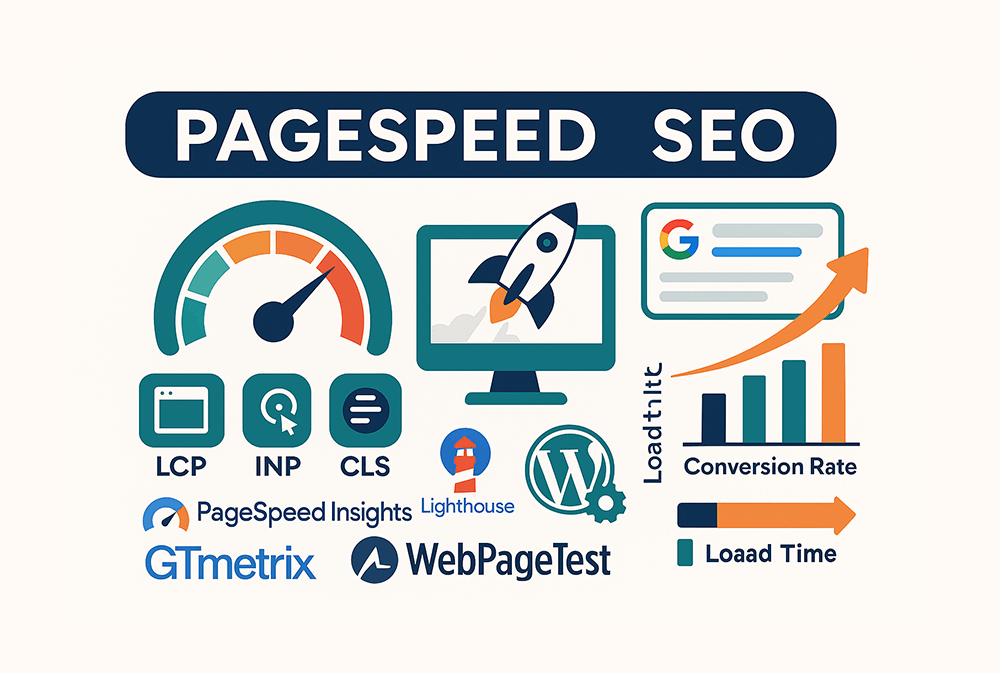
- Free tools exist. PageSpeed Insights, Lighthouse, GTmetrix, and WebPageTest expose the exact bottlenecks slowing you down.
- Fix the basics first. Optimise images, enable compression, implement caching, and choose quality hosting. WordPress adds extra levers (plugins, themes, database tuning) covered later in this guide.
1. Why PageSpeed Matters (More Than Ever)

Call it digital FOMO: today’s visitors expect a page to load faster than they can double-tap a cat meme. Every extra second feels like a broken promise—and broken promises quietly drain bank accounts. The bullets below show how page speed SEO (or the lack of it) steers everything from rankings to revenue, sprinkled with enough data (and terrible puns) to keep your caffeine levels up.
1.1. A Direct Ranking Signal (and Getting Stronger)
Google flirted with speed as a factor in 2010 (desktop), committed in 2018 (mobile), married Core Web Vitals in 2021, and doubled‑down with Interaction to Next Paint (INP) in March 2024. What used to be a polite nudge is now a firm shove. Bing, Yandex, and Baidu echo the sentiment, each baking user‑centric metrics into their algorithms. Meet the Vitals thresholds—LCP ≤ 2.5 s, INP ≤ 200 ms, CLS ≤ 0.1—and you earn extra visibility; miss them and you’re waving from page two.
That’s why pagespeed SEO is important – faster sites are more likely to unlock rich‑result goodies like SiteLinks Search Box and Top Stories carousels because Google trusts their technical hygiene.
1.2. Behavioural Impact: Patience Has Left the Chat
Akamai found that 53 % of mobile users bail after 3 s; Amazon famously calculated that every 100 ms delay cannibalises 1 % of revenue. Google’s own numbers show bounce probability climbing +32 % between 1 s and 3 s, then +106 % by 6 s. Slow pages trigger pogo‑sticking—users hop back to the results page, whispering “this result is meh” straight into the ranking algorithm’s ear.
1.3 Revenue Impact: Milliseconds, Millions, and the Math in Between
Deloitte’s Milliseconds Make Millions report logged 8–10 % conversion lifts after a 0.1‑second speed gain. Walmart noted a 2 % bump per 1 s improvement; ASOS chopped load time in half and watched bounce rate drop 12 %. Less ad spend, higher ROAS, happier CFO—speed is the rare upgrade that pleases both marketing and finance.
1.4 Crawl Budget, Energy Bills, and a Greener Web
Googlebot’s attention span is limited (sound familiar?). Bloated pages hog crawl budget, so fewer URLs get indexed and updates take longer to surface. Efficiency also slices compute cycles, hosting bills, and even carbon footprint—Cloudflare estimates that trimming a site from 5 MB to 500 KB can save enough CO₂ annually to plant a small grove of trees. Your accountant and the planet will thank you.
2. Key Metrics & What Actually Slows You Down

Think of performance metrics as the vital signs on your site’s health chart. Ignore them and you’ll be guessing in the dark; monitor them and you can prescribe the exact optimisation vitamins. Below is your cheat‑sheet—field and lab metrics, pass/fail cut‑offs, what each metric actually tracks, and the quickest ways to stop the bleeding.
|
Metric |
Good Threshold |
What It Measures |
Fast Fixes |
|---|---|---|---|
|
Largest Contentful Paint (LCP) |
≤ 2.5 s |
Time until the biggest above‑the‑fold element appears. |
Optimise hero image, lazy‑load below‑fold assets, upgrade hosting/CDN. |
|
Interaction to Next Paint (INP) |
≤ 200 ms |
End‑to‑end latency for a tap/click to produce visible feedback. |
Reduce JS bundle, defer non‑critical scripts, avoid long tasks. |
|
Cumulative Layout Shift (CLS) |
≤ 0.1 |
Visual stability—how much stuff jumps around. |
Add width/height attributes, preload fonts, avoid ads that resize. |
|
First Contentful Paint (FCP) |
≤ 1.8 s |
How fast something—anything—appears. |
Inline critical CSS, minify HTML/CSS, use HTTP/2 push/preload. |
|
Time to First Byte (TTFB) |
≤ 200 ms |
Server & network latency before first byte. |
Use edge caching, tune database, enable OPcache. |
|
Total Blocking Time (TBT) (lab) |
≤ 200 ms |
Main‑thread freeze time between FCP and TTI. |
Code‑split JS, async third‑party tags, worker‑ise heavy logic. |
|
Speed Index (SI) (lab) |
≤ 3.4 s |
Average time visible parts become complete. |
Prioritise critical resources, shrink CSS. |
|
Time to Interactive (TTI) (lab) |
≤ 5 s |
When the page feels fully usable. |
Remove render‑blocking resources, trim JS, lazy‑load widgets. |
|
First Input Delay (FID) (field) |
≤ 100 ms |
Initial input responsiveness. (Replaced by INP but still reported.) |
Same remedies as INP; light JS. |
Field vs. Lab 101
Field = real‑world CrUX data sampled from Chrome users. Lab = deterministic test on a single device/network in Lighthouse. A site can ace the lab and still bomb in the field if third‑party tags misbehave on users’ devices.
2.1. The Wall of Shame: Common Bottlenecks
- Mega‑megabyte hero images shipped in glossy PNG rather than svelte WebP.
- Render‑blocking CSS/JS loaded synchronously in
<head>. - Monolithic JavaScript frameworks where a to‑do list pulls in half of npm.
- Chat widgets, heatmaps, and ad pixels—individually harmless, collectively a black hole.
- Shared hosting running PHP 7.x with 17 neighbours mining crypto.
- Redirect chains (
/→/index.html→/home) and mixed‑content calls that force extra TLS handshakes.
2.2. How to Read the Waterfall Like a Pro
A waterfall chart is basically an ECG for your website: colourful squiggles that tell you if a critical artery is clogged by a 3‑MB hero image or a chat‑bot script you installed in 2017 and forgot about.
A. Chrome DevTools in 90 Seconds
- Open the page in Chrome, then press F12 (or ⌥⌘I on Mac) to launch DevTools.
- Click the Network tab, tick Disable cache, and select Fast 3G in throttling for a reality check.
- Hard-refresh (Ctrl + Shift + R / ⌘ + Shift + R). Colourful bars will start raining down the timeline.
- Hover any bar to inspect phases:
- Queued → connection limit; consolidate domains or use HTTP/2.
- Stalled / DNS / SSL → hosting & TLS handshake overhead.
- TTFB (green) → back-end or CDN latency clues.
- Content Download → payload size & bandwidth.
- Colour legend (Chrome 124):
- HTML/Documents
- CSS (render-blocking suspects)
- JavaScript (main-thread hogs)
- Images
- Media (video/audio)
- Fonts
- Red vertical line =
DOMContentLoaded; blue vertical line =Loadevent. Any must-have resource after the blue line is low-hanging fruit to preload. - Sort by “Duration”. Anything north of 300 ms deserves scrutiny: does this script pay rent?
B. What to Hunt For
- Long purple bars early? Critical CSS is huge or not inlined.
- Yellow chunks back-to-back? JS bundle is bloated; code-split or defer.
- Blue bar ≫ grey bar? High TTFB; tune database or adopt edge caching.
- Serial requests (grey Queued gaps) on the same host? Move to HTTP/2/3 or consolidate domains.
- Orange giants? Lazy-load background videos; provide poster images.
C. Quick Case Study
On an e-commerce landing page, hero-retina.png (3.8 MB) sat squarely in the critical path, adding 1.2 s to LCP. Converting to WebP (380 KB) and lazy-loading below the fold shaved 900 ms off mobile LCP and lifted the Google Performance score from 38 to 74—enough to escape SEO purgatory.
D. Beyond Chrome: Waterfall 2.0
- WebPageTest filmstrip: frame-by-frame visual progress mapped to requests.
- Lighthouse trace viewer: inspect scripting & rendering tasks, spot long tasks over 50 ms.
Common culprits include oversized images, render‑blocking CSS/JS, unoptimised fonts, chat widgets, excessive third‑party tags, lack of caching, and sluggish hosting. Master the waterfall once and you’ll never unsee bad performance again—your future self (and revenue graph) will thank you.
3. How to Measure Your Speed (Free & Reliable Tools)

Think of performance metrics as the vital signs on your site’s health chart. Ignore them and you’ll be guessing in the dark; monitor them and you can prescribe the exact optimisation vitamins. Below is your page speed SEO cheat-sheet—field and lab metrics, pass/fail cut-offs, what each metric actually tracks, and the quickest ways to stop the bleeding.
3.1. PageSpeed Insights
Combines real-world CrUX data with Lighthouse lab audits for both mobile and desktop. Highlights Core Web Vitals and lists Opportunities with estimated time savings so you know exactly where to trim the fat.
3.2. Lighthouse (DevTools & CLI)
Open Chrome DevTools → Lighthouse → Generate report for a one-click audit, or run the CLI in your CI pipeline to catch regressions before they hit production. Scores performance, accessibility, SEO and best practices in a tidy report.
3.3. Chrome User Experience Report (CrUX)
Field data harvested from real Chrome users. Check your Search Console Core Web Vitals report or query the public BigQuery dataset for long-term trends straight from the wild.
3.4. GTmetrix
Runs Lighthouse from multiple global nodes, captures waterfall charts and video filmstrips—perfect for before / after screenshots to wow the boss.
3.5. WebPageTest
Gives you surgeon-level control over test devices, connection speeds and multi-step journeys. Advanced metrics include INP, CLS per frame, and filmstrip views that reveal every flicker.
3.6. Pingdom Website Speed Test
A straightforward synthetic test that grades performance, lists bottlenecks and, with a free account, tracks historical trends so you can brag about progress.
4. Universal Optimisation Playbook

Ready to whip your code into shape? This playbook is the HIIT workout for page speed SEO: quick, sweat-inducing sprints like image compression, asset minification, and edge caching that collectively shave seconds off load times. Follow these reps and you’ll give Google fewer excuses to demote you—and give visitors fewer reasons to bail before the hero banner even blinks.
- Compress & Convert Images
Use WebP/AVIF; serve responsive sizes viasrcset; automate with tools like ImageMagick or build‑time plugins. If you like to do things yourself, try Tinify to convert your images to WebP format. - Enable Gzip/Brotli Compression
Configure at the server or CDN edge to shrink HTML, CSS and JS 20–80 %. - Minify & Concatenate Assets
Strip whitespace/comments and merge files to reduce HTTP requests; build tools like esbuild do this near‑instantly. - Defer or Async JavaScript
Prevent render blocking; move non‑critical scripts to the footer. - Inline Critical CSS
Deliver above‑the‑fold styles first, then lazy‑load the rest. - Leverage Browser Caching
Set far‑futureCache‑Controlheaders for static assets; bust cache via content hashes. - Adopt a CDN
Distribute assets via edge nodes; plus free TLS and HTTP/2/3. Our the best choice overall – Cloudflare, but you can also have a look at Fastly, Akamai, Amazon CloudFront (AWS), Imperva, etc. You can always choose the fastest CDN, but we prefer stability and reliability of Cloudflare. - Upgrade Protocols
HTTP/2 multiplexes requests; HTTP/3 adds QUIC for lower latency. - Optimise Fonts
Usefont-display: swap, subset glyphs, preload WOFF2. - Reduce Third‑Party Script Bloat
Audit tags monthly; load marketing pixels via a tag manager with consent‑driven triggers. - Trim Redirects & Chains
Each hop is network latency you pay for. - Monitor Continuously
Automate Lighthouse CI or WebPageTest scripts; alert on regressions.
5. WordPress‑Specific Optimisation Cheatsheet
Yes, we build on WordPress too—and we’ll happily defend our crush on this CMS at any developer dinner party. While WordPress sites have a reputation for waddling around the web like a plugin-stuffed penguin, we put them on a page speed SEO diet: static-file caching at the edge, database object caching under the hood, and lean, custom-built themes that shave off every redundant byte. The result? Pages that sprint like hand-coded static sites yet keep WordPress’s deluxe content editor, vast plugin playground, and client-friendly workflow intact—basically the best of both worlds without the typical bloat baggage.
5.1. Pick a Lean Theme
Choose lightweight foundations like GeneratePress, Astra or Kadence — all ship <50 KB of CSS and avoid jQuery bloat.
5.2. Cache Everything Smartly
- Full-page caching: FlyingPress, WP Rocket, LiteSpeed Cache or Cloudflare APO.
- Object caching: Redis + Object Cache Pro for database queries.
5.3. Image Smarts
Free WebP Express plugin, ShortPixel, Imagify or the native Image Optimization in LiteSpeed Cache convert uploads to WebP/AVIF and auto-generate responsive sizes.
5.4. Minify & Combine
Most cache plugins handle minification; for surgical control use Perfmatters or Asset CleanUp to dequeue unused styles and scripts per page.
5.5. Lazy-Load Everything
WordPress 5.9 added native loading="lazy" for images/iframes; plugins extend this with smart thresholds and fine-grained exclusions.
5.6. Tame the Heartbeat API
Limit AJAX polling intervals with Perfmatters to free CPU cycles on shared hosts.
5.7. Database Hygiene
Schedule clean-ups with WP-Optimize: purge transients, trim post revisions, delete spam comments, and remove table overhead.
5.8. Upgrade the Stack
Run PHP 8.3, MariaDB 10.6+, latest Nginx or LiteSpeed, and enable HTTP/3. Faster back-end ⇒ lower TTFB.
5.9. WooCommerce Extras
- Disable cart fragments on non-shop pages.
- Cache product pages with dynamic blocks.
- Off-load search & filtering to Algolia or ElasticPress.
5.10. Measure Again & Automate Regression Tests
Integrate Lighthouse CI into GitHub Actions or Netlify builds; fail the build if scores dip below your performance budget.
6. Next Steps & Additional Resources
- Web.dev – Core Web Vitals
- Think with Google – Speed’s impact on Mobile Web
- Backlinko 2025 SEO Ranking Factors Study
- Google Search Central – Page Experience
Need a Hand?
If you’d rather focus on your business while experts handle the nitty‑gritty, book a free page speed SEO audit with Leonov Design. We’ll benchmark your current scores and deliver a concrete action plan—no jargon, just measurable gains.


